Understanding and monitoring key performance indicators for restaurants can be the difference between scraping by and running a successful eatery. These indicators highlight your restaurant’s performance and show where you can improve.
You need to track these metrics since day one, i.e., when you opened your eatery. Thankfully, monitoring these figures is never too late as long as you start doing it today.
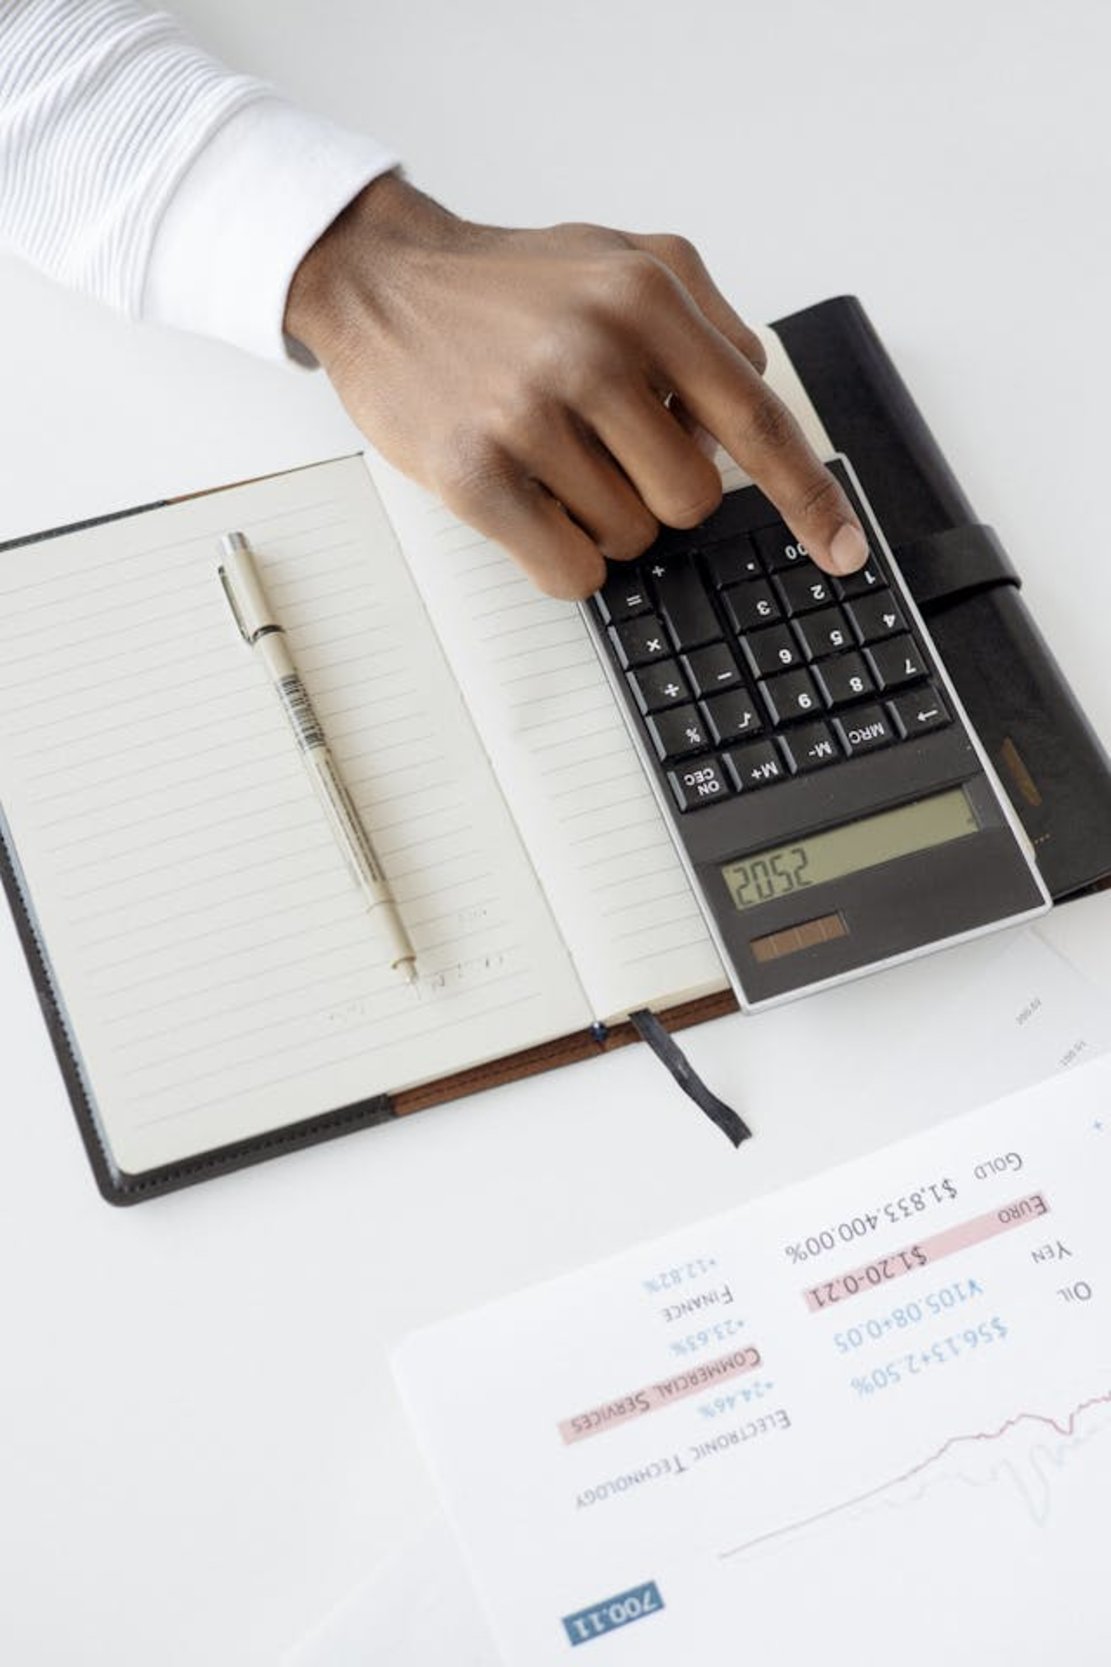
This guide explains the fundamentals of restaurant key performance indicators. Keep reading to know how your restaurant performs and what data you can use to make better decisions.

What Is a Restaurant KPI?
Key performance indicators (KPIs) are measurable values that highlight your business’s overall performance. They give you a realistic overview of your establishment’s performance as a business and eatery.
Here are some of the restaurant KPIs you’ll track regularly:
- Sales
- Customer satisfaction
- Employee productivity
- Inventory turnover
- Food costs
- Food quality
- Waste reduction
And more.
Why Is Measuring KPIs in the Restaurant Business Important?
Measuring KPIs in the restaurant business is important because:
-__ Monitor your restaurant’s performance__: You should measure your KPIs because they show your performance. For example, if you look at customer satisfaction, it is at an all-time high. This indicates that you and your staff are doing an excellent job. - Identify opportunities for improvement: It becomes easy to identify problems with your restaurant, so you know what requires your attention. For instance, your customers have to wait longer to receive their orders than your competitors. In this situation, consider introducing dishes that are easier to prepare. - Increase profit margins: When you look at your KPIs restaurant business, you’ll discover where to reduce unnecessary costs. For example, you observe significant food wastage in your restaurant. The solution will be to figure out how to reduce food wastage, decreasing the amount you spend on ingredients.
To put it another way, you must measure your KPIs because they make it easier to manage your restaurant.
Core Categories of Restaurant KPIs
You know what KPI is in the restaurant industry and its importance. Now, let’s look at the core categories of restaurant KPIs that focus on different aspects of your eatery.
Financial Performance Indicators
Let’s focus on the business side of your restaurant, i.e., financial performance indicators. These KPIs affect your eatery’s financial stability and profitability.
1. Sales Metrics These metrics highlight the revenue your restaurant generates.
Gross Profit Margin Gross profit margin shows the profitability of dishes and beverages on your menu when you serve them to your customers. You also need to know the cost of goods sold (COGS). This is the cost of sourcing, preparing, and serving the dishes and beverages to your customers.
Gross profit margin = [(Total revenue of your restaurant/Cost of goods sold (COGS)/Total revenue of your restaurant] x 100
Net Profit Margin Net profit margin is your restaurant’s profitability after accounting for all the expenses you must pay. You need to deduce costs like interest and taxes.
It’s also important to know net income, which is your restaurant’s revenue after you pay all your bills and expenses. Revenue is how much money your eatery generates, but doesn’t count other expenses.
Net profit margin = (Net income/Revenue) x 100
Average Revenue per Customer The average revenue per customer highlights how much your guests spend in your restaurant. This metric allows you to track your customers’ spending habits.
Average revenue per customer = Total revenue of your restaurant/Total number of customers that visited your restaurant
Average Check Size The average check size is the amount your customers spend per order. You can increase this metric with cross-selling and upselling to increase the check size. __ Average check size = Total sales from customers/Total number of orders
2. Cost Metrics You need to monitor these different expense-related metrics while running your restaurant.
Cost of Goods Sold (COGS) The cost of goods sold (COGS) is what you spend on the ingredients to prepare the dishes on your menu. Monitoring this metric is essential because of its effect on menu pricing. Furthermore, you want to keep this metric in check, as higher COGS will reduce your profit margins.
COGS = [(Opening inventory + Additional inventory purchases - Ending inventory)]/Sales
Food Cost Percentage The food cost percentage highlights how much it costs to acquire the ingredients compared to your revenue. This metric influences the dish prices on your restaurant’s or cafe’s menu.
Food cost percentage = (Food cost/Menu price) x 100
Labor Costs Labor costs are significant because you need staff to keep your restaurant running. These expenses should include employee benefits, discounts, taxes, and wages.
Prime Cost Ratio In prime cost, you add COGS and labor costs. It highlights the largest portion of expenses you can control while running your establishment. The prime cost ratio shows how cost-efficient it is to operate your restaurant.
Prime cost ratio = (COGS + Labor costs)/Revenue
3. Cash Flow and Sustainability__ Monitoring cash flow is essential because it shows how much money you have available at any given time. It consists of two parts:
- Inflow: Inflow is the money that comes due to sales.
- Outflow: Money you spend on various expenses.
Cash Flow Management In cash flow management, you track your cash inflow and outflow. If it is positive, it means you have sufficient money to pay for various expenses. For example, you can pay your servers working in your bar on time.
Conversely, negative cash flow means more money is going out than coming into your restaurant. This can happen if you don’t keep your expenses in check. In this instance, you cannot pay your staff when it’s due because you don’t have sufficient cash.
Break-even Analysis The break-even point is the sales you need to generate to match the amount you invested in your restaurant. This metric is important because it shows the sales target you must hit to make your restaurant profitable.
Beak-even point = [(Total fixed costs)/(Average selling price per meal - Average variable cost per unit)]
To give you an example:
- You have $20,000 in fixed costs.
- The average selling price per meal is $30
- The average variable cost is $10.
Break-Even Point = [($20,000)/($30-$10)] = 1000
If you sell 1000 meals monthly, you will hit the break-even point.
Operational Efficiency Metrics
Now, let’s look at how to measure the efficiency of your restaurant’s kitchen.
1. Kitchen and Service Operations The kitchen and service operation metrics are important because they affect:
- Your restaurant’s food costs
- How quickly can you serve your guests the food they ordered
Kitchen Prep Time and Turn Time Kitchen prep time is the average time your chefs spend preparing the dishes. It’s good to keep the prep time low so your staff can quickly serve your customers after receiving the orders. If the kitchen prep time is high, your guests won’t be happy with your service.
You must plan what to put on your menu because it affects the prep time.
Turn time or table turnover is the time it takes for your customers to leave their tables. The timer starts when your guests sit at their tables and ends when they get up and leave your restaurant.
__Kitchen prep time = Average time it takes for your kitchen staff to prepare the meals Turn time = Total time spent by guests to eat at your restaurant/Number of groups __
Order Accuracy Rate The order accuracy rate highlights the percentage of orders your restaurant prepared according to your guests’ requests. As a restaurant owner, you must focus on increasing the order accuracy rate because:
- It reduces food waste
- It improves the efficiency of your kitchen staff
- It ensures your customers are happy with your food
__Order accuracy rate = (Number of accurate orders/Total number of orders) x 100 __
2. Inventory Management Inventory management is vital for your restaurant because of its impact on your food costs, which affects your profits.
Inventory Turnover Rate The inventory turnover rate indicates how regularly you use and restock the ingredients in your inventory. A high turnover rate means you’re managing your stock of ingredients efficiently.
On the other hand, a lower rate highlights that the ingredients aren’t moving fast enough, or you’re overstocking.
Average inventory = (Starting inventory + Ending inventory)/2
Inventory turnover rate = COGS/Your average inventory
Here are some restaurant KPI examples. Your starting inventory for your eatery on December 1 was $30,000. The ending inventory on December 31 was $10,000. The COGS was $40,000 for December.
Your average inventory = ($30,000 + $10,000)/2 = $20,000
Inventory turnover rate = $40,000/$20,000 = 2
This indicates you sold your inventory’s ingredients two times, which is low. It can mean one of the following things:
- There’s not enough interest or demand for specific dishes
- You’re not selling an adequate number of dishes
On the other hand, a higher inventory turnover rate indicates that the dishes are popular with your guests. If this is too high, you don’t have enough stock to meet the current demand.
Waste Management Efficiency Waste management efficiency monitors the amount of food waste and its financial impact on your restaurant. Food waste can happen due to wrong orders, spoilage, and over-portioning or over-preparation of dishes.
There are three types of food waste:
- Kitchen waste: Kitchen waste occurs due to the preparation of dishes. It can also happen if you prepare the wrong meals for your guests.
- Plate waste: Plate waste is food waste that occurs because the portion size is large. It can also take place when your guests over-order.
- Spoilage: Spoilage is ingredients your kitchen can no longer use because of improper storage or because they are inedible.
Total ingredient usage = (Starting inventory + Purchased ingredients) - Ending inventory
Total food waste = Plate waste + Spoilage + Kitchen waste
Waste management efficiency = (Total food waste/Total ingredient usage) x 100
Ideally, you want to keep this metric low because it improves your restaurant’s COGS and boosts your profit margins.
Restaurant composting is another solution to manage excess waste.

Customer Satisfaction Metrics
Focusing on customer satisfaction is beneficial for your restaurant. Satisfied customers will be happy to return to your establishment. Moreover, they’ll recommend your eatery to people they know. In other words, satisfied customers equal an increase in sales.
1. Customer Feedback Loops A customer feedback loop provides insight into your diner’s experience. This involves collecting your guests’ opinions and using their feedback to improve your operations. Here are different metrics that help you understand your customers’ satisfaction.
Customer Satisfaction Score (CSAT) For the Customer Satisfaction Score (CSAT), you must survey your customers to rate your restaurant on satisfaction. The scale is usually 1 - 5, where one is the lowest and five is the highest. You can also use 1 - 10.
Once you collect their scores, use this formula to calculate the CSAT:
CSAT = (Total Number of satisfied guests/Total number of participants) x 100
If you use a 1 - 5 scale, satisfied guests will rate your restaurant four or five.
Net Promoter Score (NPS) The net promoter score (NPS) metric shows how satisfied customers are with your restaurant. To collect this metric, you must ask your guests how likely they are to recommend your eatery to others. They must answer this question by rating you on a scale between 1 - 10.
- If a guest selects 9 - 10, consider them as promoters of your business.
- When a patron selects 7 - 8, they fall into the passive category.
- If the rating is six or below, you classify these guests as detractors.
Once you collect a sufficient sample size, i.e., you ask a group of customers, use this formula to find NPS:
NPS = Total percentage of promoters - Total percentage of detractors.
Online Reviews and Ratings You also need to look at your restaurant’s online reviews and ratings. For instance, on Google, what percentage of reviews are positive? You should also check other platforms like TripAdvisor and Yelp. Consider four and five-star reviews as positive experiences on these platforms.
2. Repeat Customer Rate Repeat customers are good for your restaurant because they indicate that these guests are happy dining in your establishment. If you have a large percentage of repeat customers, it shows you have loyal patrons. Similarly, if this figure is low, you need to provide a better experience to your customers.
Repeat customer rate = (Total number of repeat customers/Total number of customers) x 100
3. Walk-ins vs. Reservations Analysis Comparing walk-ins vs. reservations is important for your restaurant because you learn about customers’ preferences. If you’re looking to improve your table turnover metrics, you must monitor these KPIs for restaurant businesses.
Walk-ins vs. Reservations = (Number of walk-in customers/Number of customers that reserve tables)
Employee Engagement Metrics
Your staff are vital for running a successful restaurant. Employee engagement metrics show where you can improve to keep your staff happy.
1. Staff Turnover Rate The staff turnover rate shows the percentage of employees who no longer work in your restaurant. A higher staff turnover rate is expensive because you must constantly hire and train new employees.
You may not always have access to a large talent pool. Moreover, a high staff turnover rate indicates that your employees are unhappy with the working conditions in your restaurant.
Staff turnover rate = (Number of employees that leave your restaurant/Total number of employees in your restaurant) x 100
2. Employee Satisfaction Score It’s also important to look at your employee satisfaction score. This metric highlights your employees’ happiness with their work environment and roles. Ask your employees for feedback or rate your restaurant on a scale of 1 - 5 through anonymous surveys.
Employee satisfaction score = Number of satisfied employees/Total number of employees that participate in the survey) x 100
3. Training Completion Rate The training completion rate shows the percentage of employees who finished your training program. This includes safety practices, knowledge about your menu, and more. It ensures your staff have the necessary training to provide excellent customer service.
A lower score indicates you need to take another look at the training program. You may have to update the training modules or provide enough time to complete the program.
Training completion rate = (Number of staff that completed your training program/Total number of staff that are a part of the training program) x 100
Marketing and Promotion Performance
When you’re running restaurant marketing campaigns or promotions, the following metrics will help evaluate their effectiveness. They highlight whether the campaigns are helpful or if you need different strategies.
1. Return on Marketing Investment (ROMI) The return on marketing investment (ROM) highlights how much revenue you earn from your promotional campaigns. It can stop you from spending unnecessarily on campaigns that are draining your resources without providing meaningful returns.
Return on marketing investment (ROMI) = (Revenue you receive from your marketing campaigns - Total cost of marketing campaign)/Total cost of marketing campaign
2. Promotion Redemption Rate The promotion redemption rate is an excellent way to determine how many guests redeem your coupons, offers, and discounts. If this metric is low, it indicates your promotional campaigns aren’t appealing to your customers. It can also mean that not enough people know about your promotions.
Promotion redemption rate = (Total number of promotions used by customers/Total number of promotions available) x 100
3. Customer Acquisition Cost (CAC) Customer acquisition cost reveals how much you spend on various strategies to convert people in your target audience into customers. Ideally, you want to keep this metric low because it highlights that your marketing campaigns are effective.
Customer acquisition cost = (Total spend on marketing campaigns/Total number of new customers acquired through marketing)
Advanced Restaurant KPI
You must examine this advanced KPI for restaurants to evaluate your eatery’s performance.
1. Revenue per Available Seat Hour (RevPASH) Revenue per Available Seat Hour (RevPASH) measures what you can expect to receive per hour for every seat. This helps optimize your seating capacity, menu pricing, and table turnover.
Revenue per available seat hour = Total Revenue/(Total seating capacity of your restaurant x number of hours your restaurant remains open every day)
Benchmarking Your KPIs
You know the importance of collecting and analyzing your restaurant business KPIs. However, these metrics are only valuable when you benchmark them, i.e., compare them to the industry standards.

1. Competitive Analysis In a competitive analysis, you compare your restaurant performance metrics against those of your competitors. This shows whether your performance is top-notch, average, or lagging.
It identifies issues with your restaurant so you can improve them and provide a better dining experience. You can also identify trends and make the first move to gain a market advantage. You need to compare KPIs like RevPASH, labor cost, average check size, and food cost, to name a few.
Common Mistakes in KPI Monitoring
Make sure you avoid the following mistakes while monitoring your restaurant KPIs:
- Focusing on too many KPIs: Tracking KPIs for restaurants is important. But it shouldn’t reach a point where you focus on so many KPIs that the process becomes overwhelming. You should always start with the essentials first before tracking other metrics.
- Setting unachievable goals: When you analyze and benchmark your KPIs, you know where your restaurant stands. To improve your performance, you need to set relevant targets. However, if the goals are unachievable, i.e., too high, they can harm your restaurant. Your staff will feel demotivated, and productivity will drop.
- Only tracking your KPIs: The restaurant KPIs mean nothing if you don’t act after collecting the data. You must create strategies to make the most of the available information. Otherwise, you won’t see any improvement in your restaurant’s metrics.
You know what KPI is in a restaurant and how to use it to make improvements.
When running a restaurant, you must provide WiFi because it has become part of the dining experience. You can get creative and turn this utility into an asset with Beambox’s WiFi marketing solutions.
With Beambox, you can:
- Ask guests to complete the customer satisfaction survey
- Request your patrons to leave a rating and review your restaurant on popular platforms
- Promote exclusive offers and new menu items to diners who use your WiFi
- Improve network security by only allowing your guests to access your network
And there’s a lot more you can do with our tool. The best part is that you don’t need coding skills to integrate our service with your network.
Join Beambox today and get a 30-day free trial to test the power of WiFi marketing!
Get Started With Free WiFi Marketing
Beambox helps businesses like yours grow with data capture, marketing automation and reputation management.
Sign up for 30 days free
